UML-Diagrams
The UML diagrams are categorized into structural diagrams, behavioral
diagrams, and also interaction overview diagrams. The
diagrams are hierarchically classified in the following figure:

Behavioral Diagrams:
Behavioral diagrams portray a dynamic view of a system or the
behavior of a system, which describes the functioning of the system. It
includes use case diagrams, state diagrams, and activity diagrams. It defines
the interaction within the system.
Ø State Machine
Diagram: It is a behavioral diagram. it portrays the system's behavior
utilizing finite state transitions. It is also known as the State-charts diagram.
It models the dynamic behavior of a class in response to external stimuli.
Notation of a State Machine Diagram
Following are the notations of a state machine diagram enlisted
below:

Types of State
The UML consist of three states:
- Simple state: It does not constitute any
substructure.
- Composite state: It consists of nested
states (substates), such that it does not contain more than one initial
state and one final state. It can be nested to any level.
- Submachine state: The submachine state is
semantically identical to the composite state, but it can be reused.
Example of a State Machine Diagram
An example of a top-level state machine diagram showing Bank
Automated Teller Machine (ATM) is given below.

Ø Activity Diagram: It models the
flow of control from one activity to the other. With the help of an activity
diagram, we can model sequential and concurrent activities. It visually depicts
the workflow as well as what causes an event to occur.
Components of an Activity Diagram
Activities
The categorization of behavior into
one or more actions is termed as an activity. In other words, it can be said
that an activity is a network of nodes that are connected by edges. The edges
depict the flow of execution. It may contain action nodes, control nodes, or
object nodes.
The control flow of activity is
represented by control nodes and object nodes that illustrates the objects used
within an activity. The activities are initiated at the initial node and are
terminated at the final node.

Activity partition
/swimlane
The swimlane is used to cluster all
the related activities in one column or one row. It can be either vertical or
horizontal. It used to add modularity to the activity diagram. It is not
necessary to incorporate swimlane in the activity diagram. But it is used to
add more transparency to the activity diagram.

Forks
Forks and join nodes generate the
concurrent flow inside the activity. A fork node consists of one inward edge
and several outward edges. It is the same as that of various decision
parameters. Whenever a data is received at an inward edge, it gets copied and
split crossways various outward edges. It split a single inward flow into
multiple parallel flows.

Join Nodes
Join nodes are the opposite of fork
nodes. A Logical AND operation is performed on all of the inward edges as it
synchronizes the flow of input across one single output (outward) edge.

Pins
It is a small rectangle, which is
attached to the action rectangle. It clears out all the messy and complicated
thing to manage the execution flow of activities. It is an object node that
precisely represents one input to or output from the action.
Notation of an Activity diagram
Activity diagram constitutes following notations:
Initial State: It depicts the
initial stage or beginning of the set of actions.
Final State: It is the stage
where all the control flows and object flows end.
Decision Box: It makes sure
that the control flow or object flow will follow only one path.
Action Box: It represents the set of actions
that are to be performed.

Example of an Activity Diagram

Ø Use Case Diagram: It represents the
functionality of a system by utilizing actors and use cases. It encapsulates
the functional requirement of a system and its association with actors. It
portrays the use case view of a system.
Purpose of Use Case Diagrams
The main purpose of a use case diagram is to portray the dynamic
aspect of a system. It accumulates the system's requirement, which includes
both internal as well as external influences. It invokes persons, use cases,
and several things that invoke the actors and elements accountable for the
implementation of use case diagrams. It represents how an entity from the
external environment can interact with a part of the system.
Following are the purposes of a use case diagram given below:
- It
gathers the system's needs.
- It
depicts the external view of the system.
- It
recognizes the internal as well as external factors that influence the
system.
- It
represents the interaction between the actors.
Example of a Use Case Diagram

Here
the Web Customer actor makes use of any online shopping website to purchase
online. The top-level uses are as follows; View Items, Make Purchase, Checkout,
Client Register. The View
Items use case is utilized by the customer who searches
and view products. The Client
Register use case allows the customer to register itself
with the website for availing gift vouchers, coupons, or getting a private sale
invitation. It is to be noted that the Checkout is an included use case,
which is part of Making
Purchase, and it is not available by itself
The View Items is
further extended by several use cases such as; Search Items, Browse Items, View
Recommended Items, Add to Shopping Cart, Add to Wish list. All of these
extended use cases provide some functions to customers, which allows them to
search for an item. The View Items is further extended by several use cases
such as; Search Items, Browse Items, View Recommended Items, Add to Shopping
Cart, Add to Wish list. All of these extended use cases provide some functions
to customers, which allows them to search for an item
UML Interaction Diagram
, the interaction
diagram portrays the interactions between distinct entities present in the
model. It amalgamates both the activity and sequence diagrams. The
communication is nothing but units of the behavior of a classifier that
provides context for interactions.
A set of messages that
are interchanged between the entities to achieve certain specified tasks in the
system is termed as interaction. It may incorporate any feature of the
classifier of which it has access. In the interaction diagram, the critical
component is the messages and the lifeline.
In UML, the
interaction overview diagram initiates the interaction between the objects
utilizing message passing. While drawing an interaction diagram, the entire
focus is to represent the relationship among different objects which are
available within the system boundary and the message exchanged by them to
communicate with each other.
Notation
of an Interaction Diagram

Use
of an Interaction Diagram
The interaction diagram can be used for:
- The
sequence diagram is employed to investigate a new application.
- The
interaction diagram explores and compares the use of the collaboration
diagram sequence diagram and the timing diagram.
- The
interaction diagram represents the interactive (dynamic) behavior of the
system.
- The
sequence diagram portrays the order of control flow from one element to
the other elements inside the system, whereas the collaboration diagrams
are employed to get an overview of the object architecture of the system.
UML Timing Diagram
In UML, the timing diagrams are a part of Interaction diagrams
that do not incorporate similar notations as that of sequence and collaboration
diagram. It consists of a graph or waveform that depicts the state of a
lifeline at a specific point of time. It illustrates how conditions are altered
both inside and between lifelines alongside linear time axis.
Basic
concepts of a Timing Diagram
Lifeline
As the name suggests,
the lifeline portrays an individual element in the interaction. It represents a
single entity, which is a part of the interaction. It is represented by the
classifier's name that it depicts. A lifeline can be placed within a
"swimlane" or a diagram frame.

Lifelines representing
instances of a System and Virus
State or Condition
Timeline
The timing diagram
represents the state of a classifier or attributes that are participating, or
some testable conditions, which is a discrete value of the classifier.
In UML, the state or
condition is continuous. It is mainly used to show the temperature and density
where the entities endure a continuous state change.

Timeline showing the
change in the state of virus between dormant, Propagation, Triggering,
Execution
Duration Constraint
The duration
constraint is a constraint of an interval, which refers to duration interval.
It is used to determine if the constraint is satisfied for a duration or not.
The duration constraint semantics inherits from the constraints.
The negative trace
defines the violated constraints, which means the system is failed. A graphical
association between duration interval and the construct, which it constrains,
may represent a duration constraint.

Ice should melt into
the water in 1 to 6 mins.
Time Constraint
It is an interval
constraint, which refers to the time interval. Since it is a time expression,
it depicts if the constraint is satisfied or not. The constraints dispense its
time constraints semantics.
The negative trace
defines the violated constraints, which means the system is failed. The time
constraint is represented by a graphical association between the time interval
and the construct which it constrains.
The graphical association
is mainly represented by a small line in between a time interval and an
occurrence specification.
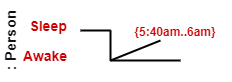
A person should wakeup
in between 5:40 am, and 6 am
Destruction Occurrence
The destruction
occurrence refers to the occurrence of a message that represents the
destruction of an instance is defined by a lifeline. It may subsequently
destruct other objects owned by the composition of this object, such that
nothing occurs after the destruction event on a given lifeline. It is
represented by a cross at the end of a timeline.

Virus lifeline is
terminated
Example
of a Timing Diagram

Following are the seven-stage Alzheimer disease framework
explained below:
- No Impairment, Normal State
It is the stage where the memory and cognitive abilities look normal. - Normal Aged Forgetfulness
It is mostly seen in people with an age group of 65 who experience subjective complaints of cognitive and/or functional difficulties, which means they face problems in recalling the name and past 5 to 10 years of history. - Early Confusional, Mild Cognitive Impairment
It causes a problem in retrieving words, planning, organizing, objects misplacing as well as forgetting fresh learning, which in turn affects the surrounding. - Late Confusional, Mild Alzheimer's
In this, a person forgets the most recent events and conversations. The person remembers himself and his family, but face problems while carrying out sequential tasks such as cooking, driving, etc. Its duration is about two years, - Early Dementia, Moderate Alzheimer's
In this, the person cannot manage independently. He faces difficulty in recalling the past details and contact information. It lasts for about 1.5 years. - Middle Dementia, Moderately Severe Alzheimer's
It leads to insufficient awareness about current events, and the person is unable to recall the past. It causes an inability in people to take a bath and dress up independently. It lasts for about 2.5 years approximately. - Late or Severe Dementia, Failure to Thrive
It is severely limited intellectual ability. In this, a person either communicates through short words or cries, which leads health to decline as it shut down the body system. Its duration is 1 to 2.5 years.
Sequence Diagram
The sequence diagram represents the flow of messages in the
system and is also termed as an event diagram. It helps in envisioning several
dynamic scenarios. It portrays the communication between any two lifelines as a
time-ordered sequence of events, such that these lifelines took part at the run
time. In UML, the lifeline is represented by a vertical bar, whereas the
message flow is represented by a vertical dotted line that extends across the
bottom of the page. It incorporates the iterations as well as branching.
Notations
of a Sequence Diagram
Lifeline
An individual participant in the sequence diagram is represented
by a lifeline. It is positioned at the top of the diagram.

Actor
A role played by an entity that interacts with the subject is
called as an actor. It is out of the scope of the system. It represents the
role, which involves human users and external hardware or subjects. An actor
may or may not represent a physical entity, but it purely depicts the role of
an entity. Several distinct roles can be played by an actor or vice versa.
Activation
It is represented by a thin rectangle on the lifeline. It
describes that time period in which an operation is performed by an element,
such that the top and the bottom of the rectangle is associated with the
initiation and the completion time, each respectively.

Messages
The messages depict the interaction between the objects and are
represented by arrows. They are in the sequential order on the lifeline. The
core of the sequence diagram is formed by messages and lifelines.
Following are types of messages enlisted below:


Create Message: It describes a communication, particularly between the lifelines of an interaction describing that the target (lifeline) has been instantiated.


Note
A note is the capability of attaching several remarks to the
element. It basically carries useful information for the modelers.

Sequence
Fragments
- Sequence
fragments have been introduced by UML 2.0, which makes it quite easy for
the creation and maintenance of an accurate sequence diagram.
- It
is represented by a box called a combined fragment, encloses a part of
interaction inside a sequence diagram.
- The
type of fragment is shown by a fragment operator.

Example
of a Sequence Diagram
Any online customer
can search for a book catalog, view a description of a particular book, add a
book to its shopping cart, and do checkout.


Comments
Post a Comment